The second edition of teaching econometrics without a textbook is here. As with most new courses, I am making significant modifications from last year. To find out about the revisions, read my draft paper on the "Pubs & Pres's" page.
0 Comments
In the fall of 2017, students were required to complete five homework assignments over the course of the semester. The five homework sets accounted for 25% of the course grade, each equally weighted. The first assignment was largely a review of basic probability and statistics. The rest covered the methods used by empirical economists to suss out causality. Below is a question from homework #1, covering chapter 1 in Mastering 'Metrics. Like this assignment, students were frequently asked to reproduce a table from the textbook. The Mastering 'Metrics web page provides links to data sets discussed, making their use ideal for class. For homework #1, I posted the NHIS 2009 data set to our course page as a csv file. Students were required to use the course software, SAS Studio, to reproduce the table. Stata do files for many tables are provided on the Mastering 'Metrics site, so if using Stata in your class, you will likely need to ask students to alter the tables in some way to avoid direct copying of the posted files. Reproducing tables from the book not only reviews the concepts covered, but gives students instant feedback as to their accuracy. All they need to do is look to see if their results match, or are at least close to, those in the book.  As expected, students struggled with this assignment, largely because it was the first time that they completed a graded assignment using SAS. Most students were still uncomfortable with the software. Perhaps because of inexperience, many did not spend an adequate amount of time on the assignment (as noted by when the files were downloaded from the course site.) As experienced programmers know, writing a program is part knowledge of the software and part trial and error. If a mistake is made, looking at the log and revising is the next step, and may need to be repeated many times. The best way to become proficient with a software is to use it! Inexperienced programmers do not realize that it is uncommon to write a program perfectly the first time and that patience is a requirement for success. Patience is a virtue! Teaching patience and persistence is a challenge in this age of immediate satisfaction.
As will be discussed in a future post, one change that I am making to the course for the 2018 edition is adding a SAS Boot Camp at the start of the semester to provide an intense period of SAS exposure and practice prior to assigning homework sets like the one above. It is my hope that during the Boot Camp students will realize that programming takes time and assignments cannot be completed a day before they are due. Do you struggle with convincing students that assignments take time and need to be started early? How do you overcome this issue? How do you instill grit in your students? Do your students end up blaming you for their poor performance? 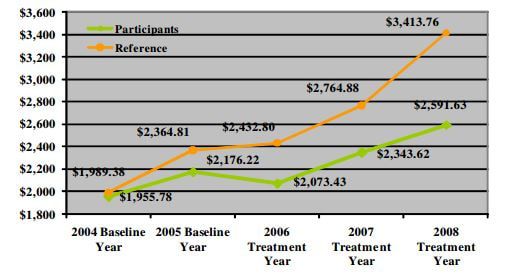 Figure 1. Source: http://www.thehealthproject.com/documents/2011/EastmanEval.pdf, downloaded from Health Affairs blog (downloaded 9/14/2017) After spending the first few lectures reviewing the Appendix to Chapter 1 in Mastering 'Metrics and basic statistics, we moved on to the meat of the book, starting with Chapter 1. Selection bias is the topic of the chapter and the use of randomized trials as a solution (although a rare and expensive one in economics.)
Workplace wellness programs are increasingly common as employers attempt to reduce health care expenditures and increase worker productivity. It is common when describing the effectiveness of wellness programs to compare the health care expenditures (usually from claims data) in the year of treatment and beyond for those enrolled and not enrolled in the program. Lower expenditures for wellness program participants is considered evidence of a successful program. What is not commonly acknowledged is the potential for selection bias. To illustrate the problem of comparing mean values without considering the potential for selection bias, the students read a Health Affairs blog post titled "Workplace Wellness Programs Produce No Savings" (Lewis, Khanna & Montrose 2014). Figure 1 is from the article and highlights the selection bias problem. In sum, a firm started a workplace wellness program for their employees in 2006 (treatment year). The authors collected annual health care expenditures pre- and post-treatment for those who were in the treatment and control groups. The naive report would note the gap between the reference group (non-participants, green line) and the participants (orange line), $822.13, as the gains (in terms of lower health care expenditures) from the wellness program. (The dollar figure would also likely be used to convince the employer to continue paying for the wellness program provider's service.) But might the future participants in the program have lower health care expenditures than the future non-participants? The authors examine claims data for each group in the two years prior the start of the program to address this issue. Not surprisingly, participants had lower expenditures prior the program. Since healthier, or at least less expensive users of health care, were selecting into the wellness program, a simple comparison of mean expenditures is composed of two portions: 1) causal and 2) selection bias. Attributing the entire difference to the causal effect of the wellness program on expenditures is incorrect. The Masters give an excellent description on page 10 and the blog post authors provide an excellent description of the dangers of ignoring selection bias when considering the ROI of wellness programs. In reality, measuring the share of the difference due to selection bias is difficult since we cannot clone people and observe them in two states at one point in time. So, what is a responsible economist to do? One solution is the use of randomized trials. For the next two classes we will discuss how randomized trials remove the bias and discuss examples of such in the economics literature. In particular, we will read and discuss Finkelstein et al.'s analysis of the health insurance experiment in Oregon. (Finkelstein, Amy, et al., “The Oregon Health Insurance Experiment: Evidence from the First Year,” The Quarterly Journal of Economics 127, August 2012, 1057-1106.) On another note, a homework using the National Health Insurance Survey data set (posted on www.masteringmetrics.com) is due next week. Students must reproduce Table 1.1 using SAS. The objectives of the assignment are 1) apply lessons from SAS Programming I and 2) gain experience using a data set. Feedback and details of the assignment will be the topic of a future post. How do you discuss selection bias in your class? What examples do you use? My previous 12 econometrics courses were standard courses. After a brief introduction or review of mathematical and statistical principles and rules, the course focused on the Classical Linear Regression Assumptions and then systematically addressed the common violations of these assumptions. For each violation (ex. heterskedasticity), I defined the violation, noted the issued caused, reviewed methods of detection, and offered solutions (if possible) for the problem. If time in the semester remained, I covered linear probability and probit models. Rarely was there time for time series analysis. Assessment consisted of two tests and a final, several homework sets, and an empirical paper. The paper was due in parts, beginning with a prospectus in the first few weeks of class, to incentivize working on the project throughout the semester rather than the final few weeks of the term.
Over these years I was frustrated with the average outcome of the course. On tests, students clearly were using memorization to prepare (ex. prove beta1-hat is an unbiased estimator for beta1 in a SLR model) and struggled with interpretation and thinking creatively. For homeworks, I suspect students spent a significant amount of time searching for answers to textbook problems and others online rather than working through them and learning the material. The empirical paper was the best learning tool and most students surprised themselves with what they could do and what they had learned. Still, I remained unsatisfied with the course structure and outcomes and believed that the final papers could be much better. As mentioned in the first post on this blog, reading "Undergraduate Econometrics Instruction: Through Our Classes, Darkly" both pinpointed the trouble in my course and gave me the courage to try something new. Angrist and Pischke's abstract states: "The past half‐century has seen economic research become increasingly empirical, while the nature of empirical economic research has also changed. In the 1960s and 1970s, an empirical economist’s typical mission was to “explain” economic variables like wages or GDP growth. Applied econometrics has since evolved to prioritize the estimation of specific causal effects and empirical policy analysis over general models of outcome determination. Yet econometric instruction remains mostly abstract, focusing on the search for “true models” and technical concerns associated with classical regression assumptions. Questions of research design and causality still take a back seat in the classroom, in spite of having risen to the top of the modern empirical agenda. This essay traces the divergent development of econometric teaching and empirical practice, arguing for a pedagogical paradigm shift." My fall 2017 econometrics course will move away from focusing on the "true model" and the "technical concerns associated with classical regression assumptions" and move towards the doing of econometrics. After a review of mathematical and statistical concepts needed for the course, we will focus on the major methods used by economists today: randomized trials, regression, IV, regression discontinuity designs, and differences-in-differences. In each section students will read published journal articles that employ a particular method and use data sets to apply the methods and interpret the results. Homework sets and tests will largely be application and interpretation which will hopefully incentivize students to move away from rote memorization. The empirical paper, which will still be assigned in pieces, will remain the focus assignment, but will hopefully take on more meaning for the students as they see published work by others, the power of the econometric methods, and develop experience in using these methods. As with any major curricular change, it will take time to work the kinks out and get my materials developed. I am excited about the challenge and the learning experience for the students. **You can see the latest version of the course syllabus on the "Lecture Notes". ** Welcome to my adventure in teaching undergraduate introductory econometrics without a textbook. As you can read in more detail on the "About" page, I am prepping my fall 2017 econometrics course without a standard textbook. My goal is to focus the course more on the "doing" of econometrics and issues of research design and causality rather than econometric theory. I have been unsatisfied with the results of my course for some time, but after reading Angrist & Pischke's NBER Working Paper "Undergraduate Econometrics: Through Our Classes, Darkly" I decided to pull off the band aid and make some big changes. I believe that my students will be the better for it. This blog will trace my adventure, starting with the summer of preparations, and provide many of the materials (ex. my lecture notes and syllabus) I will use in the course. For the first iteration, I am borrowing heavily from Masters Angrist and Pischke and others who have helped their students "master 'metrics" before me. I will make changes after the semester is over to fit the course (if needed) to my students. There are a lot of unknowns right now and this course is certainly a work in progress! Below is the first draft of my syllabus. You will see that students are required to read several journal articles and Mastering 'Metrics (MM). There is not a standard textbook. The webpage for MM provides many resources including data sets and links to other courses using the book. I image that I will make use of it frequently this fall semester. Note: Syllabus updated 7/19/2017
|
AuthorFull professor of economics at a small liberal arts college in Virginia taking the leap and going textbook-less in an undergraduate econometrics course. Archives
September 2018
Categories
All
|
||
 RSS Feed
