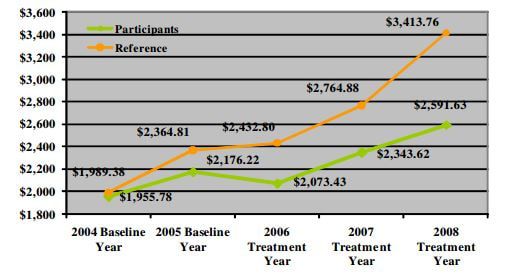
 Figure 1. Source: http://www.thehealthproject.com/documents/2011/EastmanEval.pdf, downloaded from Health Affairs blog (downloaded 9/14/2017) After spending the first few lectures reviewing the Appendix to Chapter 1 in Mastering 'Metrics and basic statistics, we moved on to the meat of the book, starting with Chapter 1. Selection bias is the topic of the chapter and the use of randomized trials as a solution (although a rare and expensive one in economics.)
Workplace wellness programs are increasingly common as employers attempt to reduce health care expenditures and increase worker productivity. It is common when describing the effectiveness of wellness programs to compare the health care expenditures (usually from claims data) in the year of treatment and beyond for those enrolled and not enrolled in the program. Lower expenditures for wellness program participants is considered evidence of a successful program. What is not commonly acknowledged is the potential for selection bias. To illustrate the problem of comparing mean values without considering the potential for selection bias, the students read a Health Affairs blog post titled "Workplace Wellness Programs Produce No Savings" (Lewis, Khanna & Montrose 2014). Figure 1 is from the article and highlights the selection bias problem. In sum, a firm started a workplace wellness program for their employees in 2006 (treatment year). The authors collected annual health care expenditures pre- and post-treatment for those who were in the treatment and control groups. The naive report would note the gap between the reference group (non-participants, green line) and the participants (orange line), $822.13, as the gains (in terms of lower health care expenditures) from the wellness program. (The dollar figure would also likely be used to convince the employer to continue paying for the wellness program provider's service.) But might the future participants in the program have lower health care expenditures than the future non-participants? The authors examine claims data for each group in the two years prior the start of the program to address this issue. Not surprisingly, participants had lower expenditures prior the program. Since healthier, or at least less expensive users of health care, were selecting into the wellness program, a simple comparison of mean expenditures is composed of two portions: 1) causal and 2) selection bias. Attributing the entire difference to the causal effect of the wellness program on expenditures is incorrect. The Masters give an excellent description on page 10 and the blog post authors provide an excellent description of the dangers of ignoring selection bias when considering the ROI of wellness programs. In reality, measuring the share of the difference due to selection bias is difficult since we cannot clone people and observe them in two states at one point in time. So, what is a responsible economist to do? One solution is the use of randomized trials. For the next two classes we will discuss how randomized trials remove the bias and discuss examples of such in the economics literature. In particular, we will read and discuss Finkelstein et al.'s analysis of the health insurance experiment in Oregon. (Finkelstein, Amy, et al., “The Oregon Health Insurance Experiment: Evidence from the First Year,” The Quarterly Journal of Economics 127, August 2012, 1057-1106.) On another note, a homework using the National Health Insurance Survey data set (posted on www.masteringmetrics.com) is due next week. Students must reproduce Table 1.1 using SAS. The objectives of the assignment are 1) apply lessons from SAS Programming I and 2) gain experience using a data set. Feedback and details of the assignment will be the topic of a future post. How do you discuss selection bias in your class? What examples do you use?
0 Comments
|
AuthorFull professor of economics at a small liberal arts college in Virginia taking the leap and going textbook-less in an undergraduate econometrics course. Archives
September 2018
Categories
All
|
 RSS Feed
